Currency
Toggle Nav

Factory Testing Workflow for LoRa Devices Before Shipping
July 09, 2025
Workflow for LoRa Devices Testing
Providing stable, long-range connectivity for widely distributed IoT devices presents an ongoing challenge. Traditional technologies like Wi-Fi and Bluetooth are limited by range, while cellular networks (4G/5G) often have prohibitively high power consumption and costs. To address this, Low-Power Wide-Area Networks (LPWANs) emerged to fill this gap. Among them, LoRa (Long Range) technology has become a leader in the field, distinguished by its exceptional long-range communication capabilities, extremely low power consumption, and excellent receiver sensitivity.
However, there is often a significant gap between the ideal performance touted in product datasheets and the stable, reliable performance achieved in real-world deployments. Bridging this gap requires a rigorous and professional testing framework. The establishment of this framework relies not only on excellent product design but also on our continuous investment in advanced, flexible, and comprehensive in-house testing facilities. This guide will delve into the key performance metrics and scientific testing methods for LoRa modules, demonstrating their practical application through the validation process of Elecrow's LoRa devices.
Connecting Your LoRa Device
Before proceeding with the formal tests, a series of preparatory steps must be completed. The first step is to flash the LoRa device with firmware specifically customized for testing. Next, open the testing software on your computer and connect the device using a Type-C cable. To enable communication between the software and the device, you need to find and select the correct serial port within the software, then click "Open Serial Port" to establish the connection. Wait for approximately 5 seconds. If successful, the message "Entry test" will appear in the software interface. This message indicates that the device is successfully connected and ready for testing.

Connected Sucessfully Screenshot
Test Sequence
1. Battery Voltage Test
Battery performance is key to determining the battery life of an IoT device. To ensure our LoRa devices can accurately report their battery status, we have designed a rigorous battery voltage validation process.
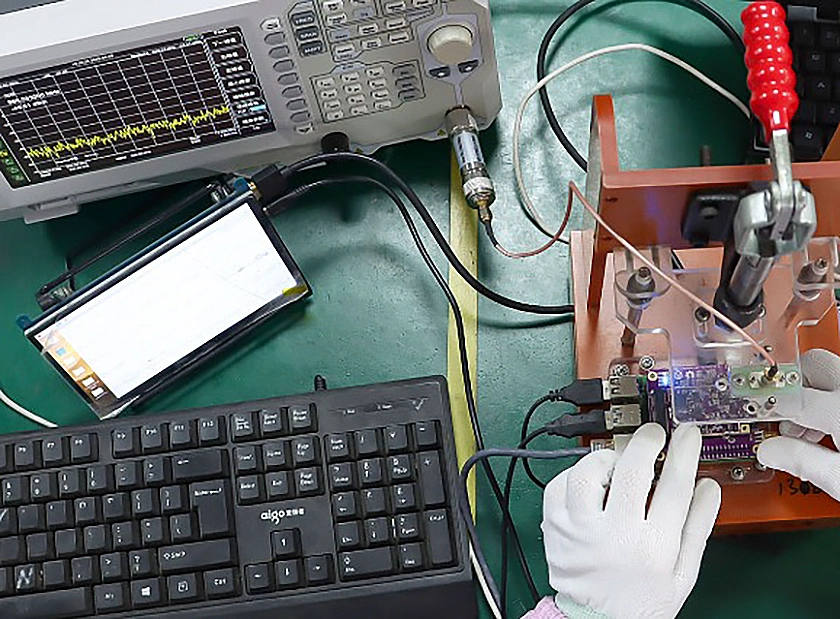
During the test, we connect the battery of the device under test (DUT) to the dedicated interface on the mainboard (PCBA). Subsequently, our automated testing software triggers the battery detection procedure. The software automatically collects and displays the real-time battery voltage reading.
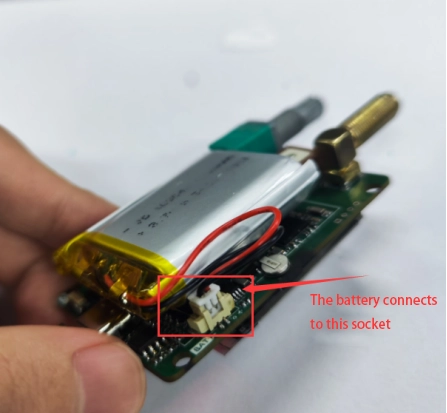
Battery connected to this Socket
To ensure the absolute reliability of the data, our test engineers simultaneously use a high-precision multimeter to take a physical measurement at the device's battery pins. By comparing the software reading with the actual value measured by the multimeter, we can verify the accuracy of the device's power monitoring circuitry.
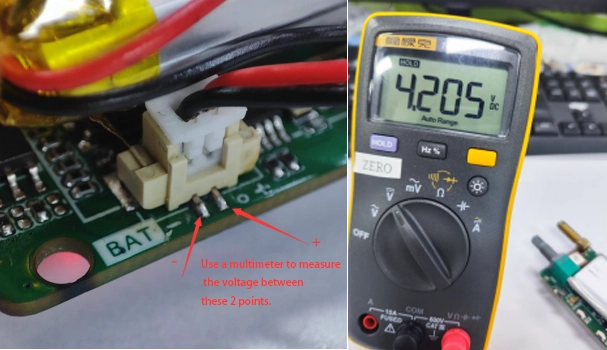
Verify with multimeter
According to our quality standards, a slight deviation of no more than ±0.02V between the reading and the actual value is permissible, ensuring that the power level information received by the user is highly accurate. Any device that does not meet this standard, such as having no voltage from the battery itself or an abnormal reading, is immediately identified and addressed, preventing any potential power-related issues from reaching the market.
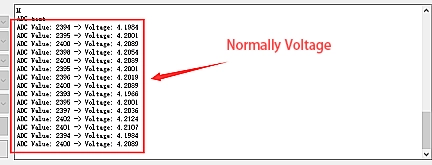
Normally Voltage (ADC Value: 2xxx -> Voltage: 4.xxxx)
2. Button Functionality Test
To ensure operational reliability, we conduct comprehensive automated tests on all physical inputs. The test scope covers the two function buttons and one toggle switch on the device. This process aims to verify the responsiveness and functional accuracy of each interactive component, thereby providing a stable and smooth user experience.
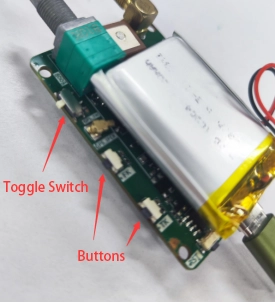
Button Test Places
When conducting the test, pressing a button will display data as follows:
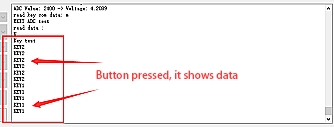
Normally show KEY1 or KEY2 or KEY3
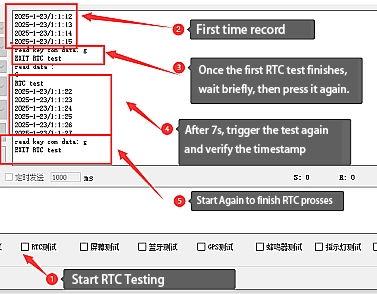
3. RTC Clock Integrity Test
We ensure the long-term reliability of the onboard Real-Time Clock (RTC) through a two-step validation process. The test program reads the clock twice in succession to verify its time accuracy and continuous operation capability. This guarantees the device's stability in critical applications such as data timestamping and scheduled wake-ups.
The procedure is roughly as follows:
(1) The test begins for the first time, and the start time is recorded.
(2) The first RTC test is completed.
(3) After a waiting period, the RTC test is repeated to observe if the time continues from the first reading.
(4) After a 7-second interval, the RTC test is restarted. If the output time corresponds with the first output, the RTC is normal, and the test passes.
(5) The RTC test is initiated once more to conclude this test item.
RTC Testing Processing
4. Display System Test
We conduct a comprehensive test on the device's E-Ink display system. This process includes verifying the screen's integrity by displaying test images and activating the frontlight system to check its brightness and adjustment functions. We ensure the brightness adjustment knob is responsive and provides smooth control, offering optimal readability for the user in various lighting conditions. (The following uses the ThinkNode-M1 as an example).
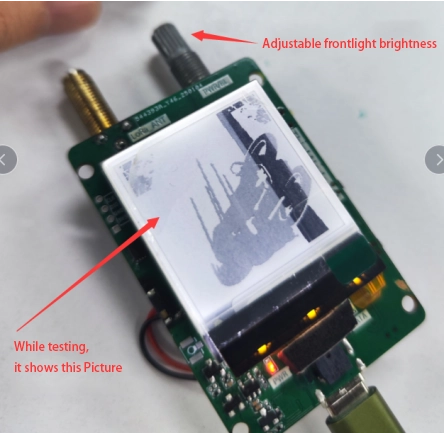
Frontlight Adjustment
During the test, the display will show the following:
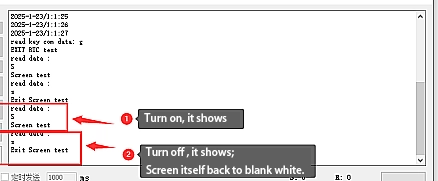
Frontlight Testing Data (Screen test ->Exit Screen test)
5. Bluetooth Connectivity Test
To facilitate user device configuration and management, we conduct rigorous testing on the onboard Bluetooth functionality. By scanning with a standard smartphone, we ensure that each device can be accurately discovered and correctly displays its device name (e.g., "ThinkNode-M1"), thereby providing users with a stable and reliable local wireless connection channel.
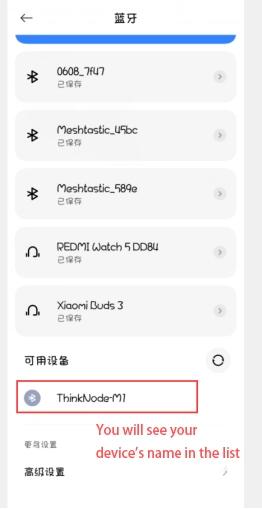
Bluetooth Connection Testing
6. GPS Test
Fast and precise positioning capability is at the core of many IoT applications. To ensure our devices provide reliable geographical location information in any scenario, we perform a series of rigorous performance validations on the onboard GPS module.
Our automated test platform initiates a dedicated GPS test sequence. During this process, the GPS module records its location data and continuously monitors its performance.
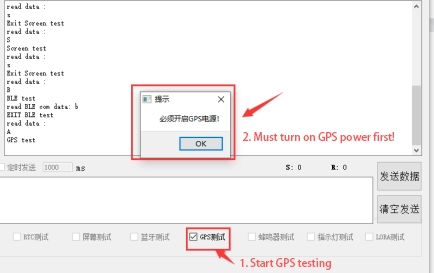
Before GPS Testing
It needed to be turn on with the toggle switch:
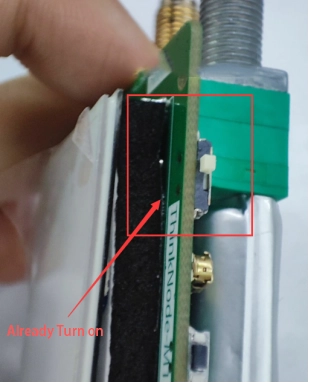
Already turn on GPS
During the test, it will display as follows:
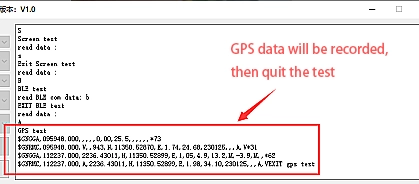
GPS Data were recorded
7. Buzzer Audio Feedback Test
To ensure the reliability of the device's alarm and notification functions, we conduct a dedicated test on the onboard buzzer. This process verifies that the buzzer can instantly emit a clear sound upon receiving a command and fall silent immediately after the command stops. This ensures reliable support for all application scenarios requiring audio feedback.
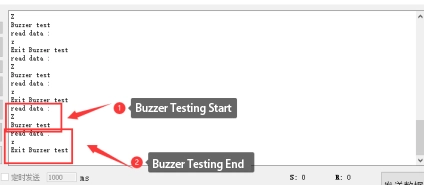
Buzzer Test -> Exit Buzzer test
8. Indicator Light Test
We conduct a comprehensive test on all LED status indicators on the device. This process verifies that each indicator can accurately light up, change color, or blink according to software commands. This ensures that users receive clear and reliable visual feedback on the device's status.
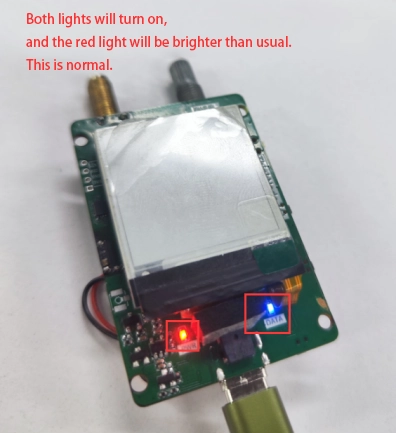
LED testing Red Light Normal
During the test, it will display as follows:
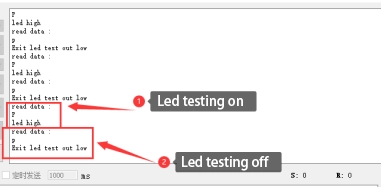
Led high -> Exit led test out low
9. Frequency and Power Analysis Test
Transmit power is the core physical metric that determines the communication range of a LoRa device. To ensure each module possesses its nominal long-range communication capability, we conduct a rigorous quantitative verification of its radio frequency (RF) transmission performance.
Test Method: We use an industry-leading, high-precision spectrum analyzer as the core testing instrument. The RF output of the module under test is connected to the spectrum analyzer via a calibrated SMA cable and a precision attenuator.
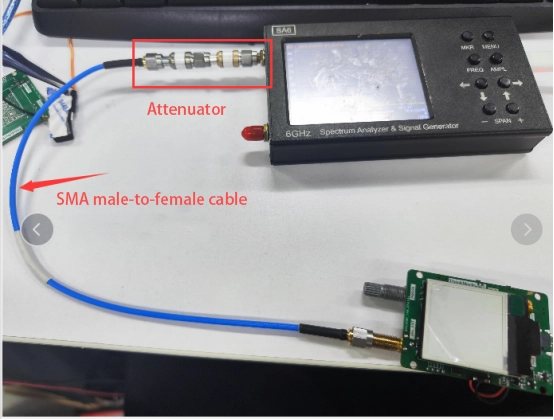
Spectrum analyzer with an attenuator
Through our testing software, we instruct the module to transmit at maximum power on its center operating frequency (e.g., 915MHz).
Spectrum Analyzer Setup Procedure
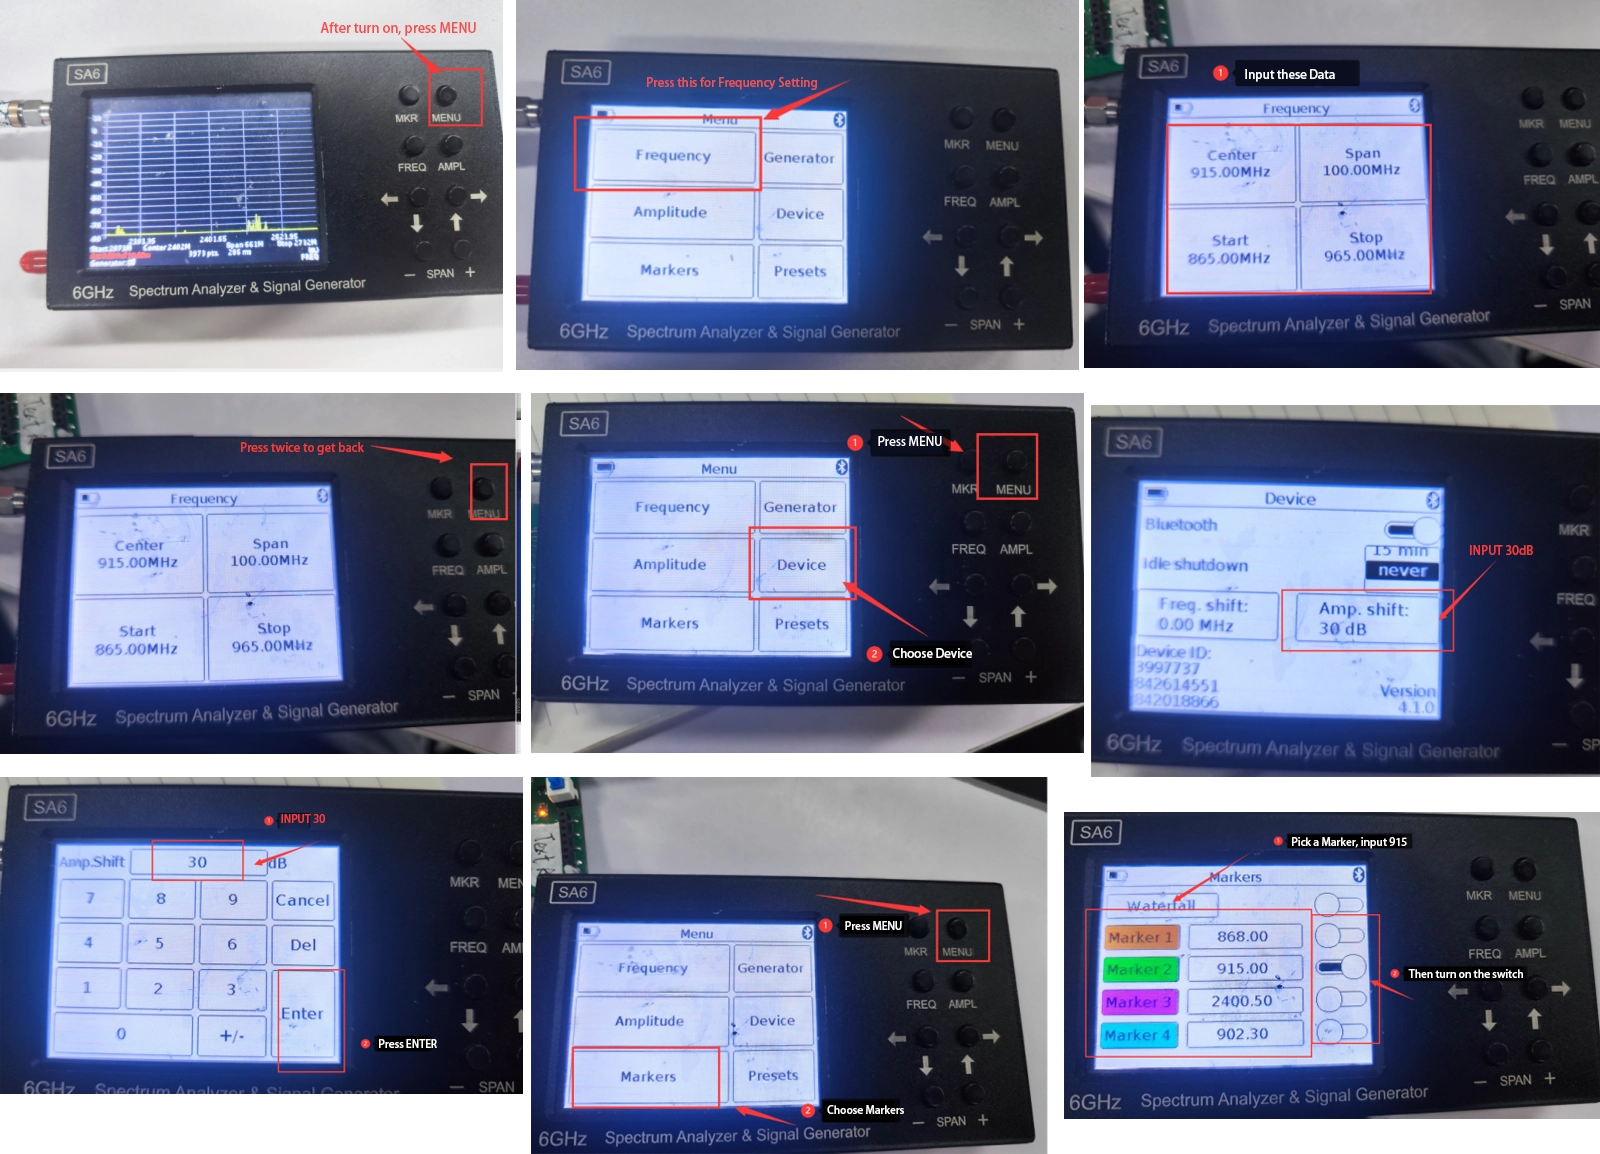
Spectrum Analyzer Setting Step by Step
Simultaneously, the LoRa frequency test is initiated, and the software will display:
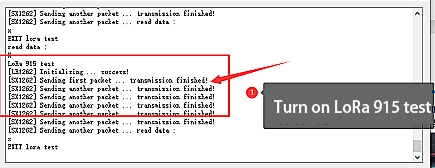
LoRa 915 test -> EXIT LoRa test
Verification Standard: The spectrum analyzer captures and plots the signal's power spectrum in real-time. Our engineers focus on its peak, using a marker for a precise reading.
A successful test must meet the following criteria: The signal's peak power must precisely reach the design specification of +22 dBm and be strictly maintained within a tolerance range of no less than +20 dBm.
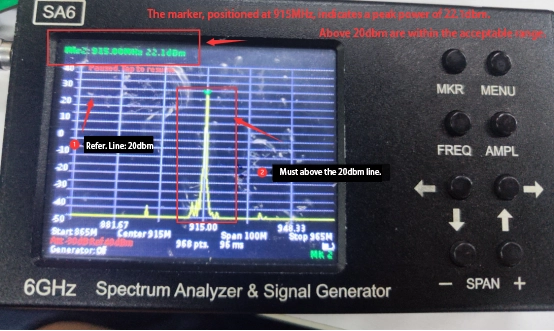
Spectrum Analyzer Data analitics
This stringent test is our solemn commitment to product performance. It ensures at the physical layer that every device you receive has powerful and stable signal transmission capabilities, laying a solid foundation for achieving exceptional long-range communication performance.
Other Modules' Frequencies and Data
| Elecrow Module Model | Core LoRa Chip | Module Type | Supported Bands/Frequencies | Key Features/Applications |
|---|---|---|---|---|
| LR1302 LoRaWAN Gateway Module (SPI EU868) | Semtech SX1302 | Gateway Module | EU868 (European standard, 863-870 MHz) | LoRaWAN Gateway Core |
| LR1302 LoRaWAN Gateway Module (SPI US915) | Semtech SX1302 | Gateway Module | US915 (North American standard, 902-928 MHz) | LoRaWAN Gateway Core |
| Elecrow nRF-LR1110 Wireless Transceiver Module | Semtech LR1110 + Nordic nRF52840 | Transceiver Module | Sub-GHz LoRa (150-960 MHz), 2.4GHz (G)FSK | LoRa, GNSS, Wi-Fi Scanning |
| Elecrow nRF-LR1262 Wireless Transceiver Module | Semtech SX1262 + Nordic nRF52840 | Transceiver Module | Full Band (150 MHz - 960 MHz) | Low-Power Long-Range LoRa |
| Elecrow nRF-LR1121 Wireless Transceiver Module | Semtech LR1121 + Nordic nRF52840 | Transceiver Module | 2.4GHz LoRa, S-Band LoRa, 2.4GHz (G)FSK | 2.4GHz LoRa, GNSS, Wi-Fi Scanning |
| LR1262 LoRaWAN Node Module | Semtech SX1262 | LoRaWAN Node Module | Full Band, typically 433/470/780/868/915 MHz | LoRaWAN End Node |
| Elecrow nRF-LLCC68 Wireless Transceiver Module | Semtech LLCC68 + Nordic nRF52840 | Transceiver Module | Sub-GHz (150 MHz - 960 MHz) | LoRa-derived modulation for (G)FSK |
| LR1262 Long Range LoRa Wireless Transceiver Module | Semtech SX1262 | Transceiver Module | Wide Frequency Range (150MHz - 960MHz) | Ultra-Low Power IoT, Industrial |
| LRCC68 Long Range LoRa Wireless Transceiver Module | Semtech LLCC68 | Transceiver Module | Wide Frequency Range (150MHz - 960MHz) | Ultra-Low Power IoT, (G)FSK Apps |
10. Low-Power Performance Test
In the final production firmware environment, we use a high-precision power analyzer to conduct rigorous low-power tests on each device. By capturing the device's complete current waveform across various operating modes, we can accurately calculate its average power consumption, providing reliable data to support the product's ultra-long battery life.
Testing for low power requires an ammeter adapter cable and an ammeter.
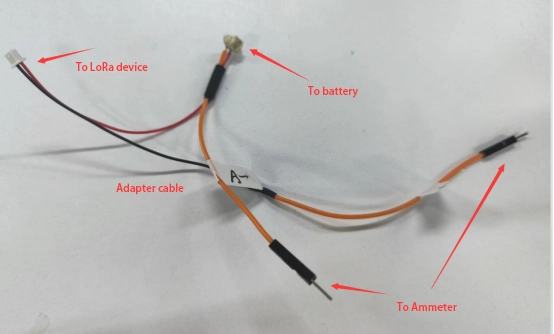
Adapter cable connection
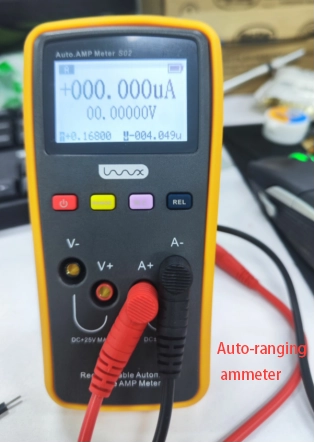
Auto-ranging ammeter
Test Procedure and Connection Method:
(1) After flashing the production firmware, power on the device. Once the system boots, the following interface will be displayed, confirming normal operation. Pressing the page-turning key allows you to switch between pages (two in total), which indicates normal functionality.
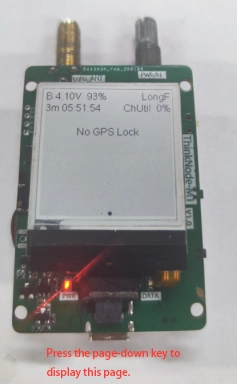
Ready for testing surface
(2) Turn the knob to the far right to power off the device. Unplug the battery cable and connect our prepared external cable, with the other end connected to the battery.
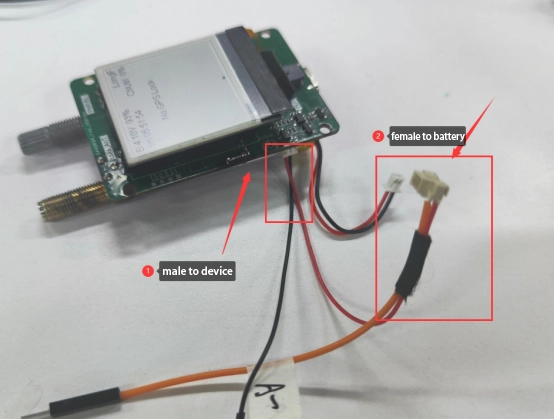
How to connect for testing
(3) Set the ammeter to auto-range. Connect the other two ends of the adapter cable to the ammeter according to their corresponding labels. (Refer to the ammeter's manual for specific usage instructions).
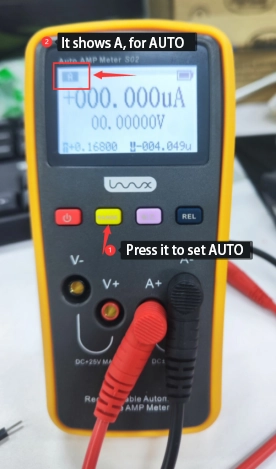
Precision ammeter Auto Setting
The overall connection should look like the image below:
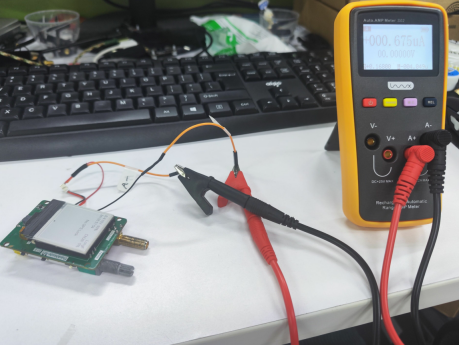
Connection Well Done
(4) Verifying and Debugging Data
In the powered-off state, the ammeter should read 0.675µA.
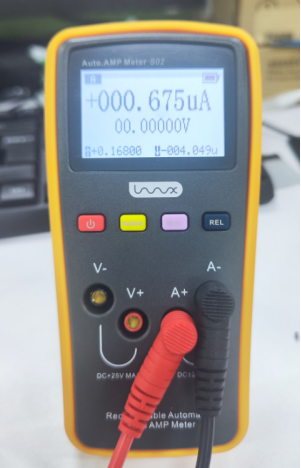
Normally Data when Shut down
After powering on and entering the system, long-press the function key to enter low-power mode. The screen will display that it is entering sleep mode.
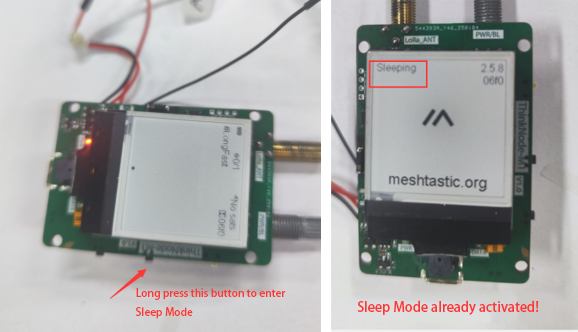
Long press and sleep mode 1&2
Once in low-power mode, the ammeter will show approximately 270µA. Toggle the switch down (to turn off the GPS); the ammeter should then read approximately 6µA, indicating that the low-power mode is functioning correctly.
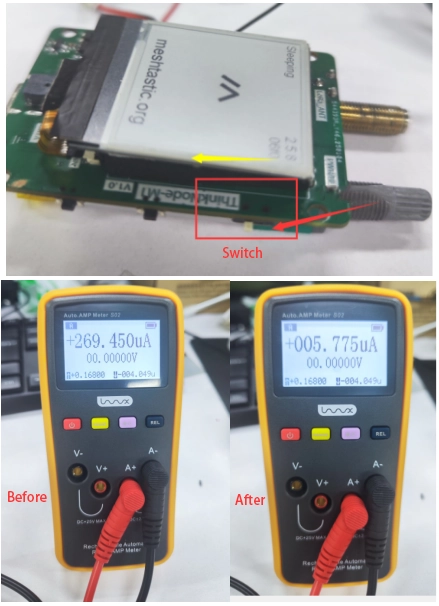
Before & After for Sleep Mode
From Our Engineers: Frequently Asked Questions (FAQ) about LoRa
In our interactions with the developer community, several practical questions arise repeatedly. Based on our test data and engineering experience, we offer direct answers to these core concerns.
Q: What is the real-world range of my LoRa device? Why can't I achieve the advertised 10 km?
A: This is the most common and complex question. The "10 km" figure is typically a theoretical maximum achieved under ideal, Line-of-Sight (LoS) conditions. Real-world range is impacted by several factors:
1. Environment: Buildings in urban areas and foliage or hills in suburban areas cause significant signal attenuation (Non-Line-of-Sight, NLoS), which is the primary reason for reduced range.
2. Antenna: Antenna performance and matching are critical. A small, poorly matched antenna can reduce communication range by 50% or more.
3. Parameter Settings: Using a higher Spreading Factor (e.g., SF11 or SF12) significantly increases range but at the cost of a lower data rate and higher power consumption.
Therefore, instead of relying on a single maximum value, we conduct the "Field Tests" described above in multiple real-world scenarios to generate signal coverage heatmaps. These reports provide a much more realistic assessment of the effective communication range in a specific urban or suburban environment.
Q: How do I choose the right Spreading Factor (SF) for my application?
A: Choosing an SF is a trade-off between range, data rate, and power consumption. Follow these principles:
• For lowest power and highest data rate (for frequent transmissions): Prioritize low SFs (SF7, SF8). This is suitable for nodes close to a gateway.
• For maximum range and robustness (for nodes at the coverage edge): Choose high SFs (SF11, SF12). This significantly increases time-on-air and battery drain, so use it only when necessary.
• A balanced approach: SF9 and SF10 often represent a good compromise between performance and power consumption.
We recommend using LoRaWAN's Adaptive Data Rate (ADR) feature to allow the network to automatically select the optimal SF for you based on current signal conditions.
Q: How long will my device *really* last on a single battery?
A: Battery life is calculated as: Battery Capacity / Average Operating Current. The key is obtaining an accurate average current. A standard multimeter is highly misleading because it cannot capture the dynamic current changes between sleep, wake, and transmit states.
Our methodology uses a high-precision Source Measure Unit (SMU) to profile the true current waveform of a device over a complete operational cycle. By integrating this waveform, we can calculate a scientifically accurate average current. Only with this value can we provide a credible battery life estimation. When you see a battery life claim, always question the measurement methodology behind it.
Q: How robust is LoRa against interference? Can it be used in environments with heavy Wi-Fi and Bluetooth traffic?
A: LoRa's robustness against interference is one of its key strengths, primarily due to its Chirp Spread Spectrum (CSS) modulation technique. CSS spreads the signal's energy over a wider bandwidth, allowing its power spectral density to fall below the noise floor. This enables the receiver to extract the useful signal even in the presence of strong interference.
In our Dynamic and Interference Tests, we actively inject strong interfering signals like Wi-Fi to verify the module's PLR under noisy conditions. The results show that LoRa maintains remarkably stable communication unless the interference is extremely powerful and continuous. This is a major advantage over other narrowband technologies operating in the crowded ISM bands.
What is more for LoRa Product
The professional testing of a LoRa module is a complex, systems-level engineering task. It is a process designed to answer the most critical questions of every developer and user with verifiable data. By combining a deep technical understanding with our comprehensive suite of advanced and flexible in-house testing infrastructure, and by integrating this process into the production of every device like the ThinkNode-M1, we can comprehensively and accurately assess real-world performance.
This complete capability, spanning from laboratory simulation and environmental stress testing to real-world field validation, represents our commitment to quality. It is our guarantee that every Elecrow LoRa product you use is a robust and reliable component, ready to serve as the cornerstone of your successful IoT solution.