


Story
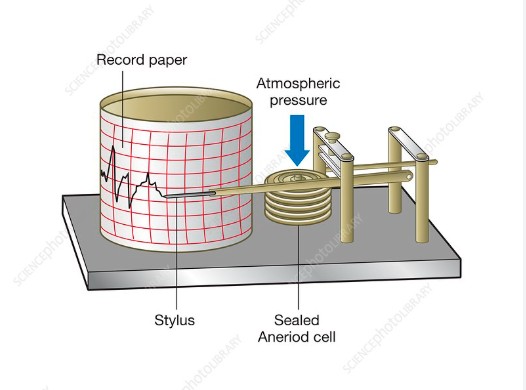
A barograph is a self-recording barometer that continuously measures and records atmospheric pressure over time. It produces a graphical record of the pressure changes on a paper chart, called a barogram.
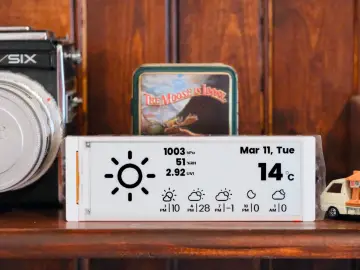
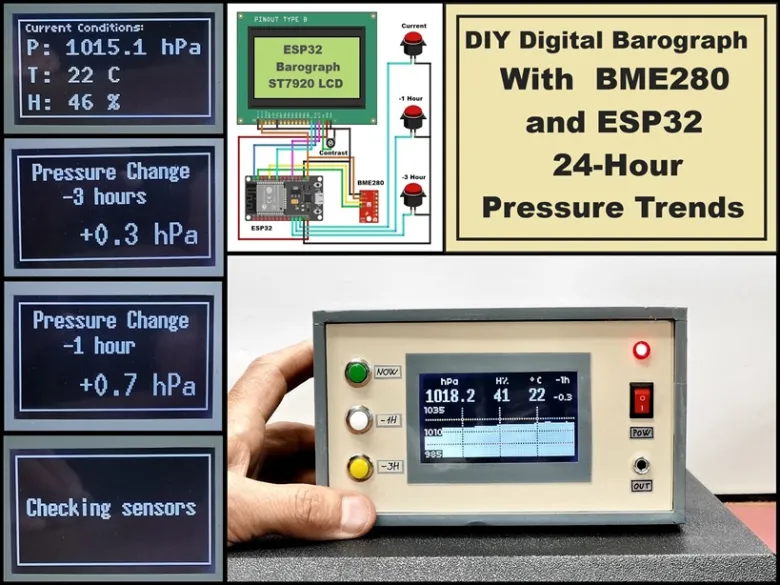
The device presented in this project is an electronic barograph and the barogram is drawn on an LCD Display instead of on paper. The trend of the barogram (rising, falling, or steady pressure) can provide insights into upcoming weather changes. A rapid drop in pressure, for example, may indicate an approaching storm.
Detailed video instructions at: https://youtu.be/VbmTXtBakw4
In one of my previous videos I presented a similar device but with fewer options and information, and a smaller Display. The device presented in this video is made in the style of commercial electronic barographs, which by the way are very expensive. The idea is taken from the shem-net site but I made significant changes and additions to the original code.
The device is really simple to make and consists of only a few components:
- ESP32 Developement Board
- 128x64 LCD Display with ST7920 driver chip
- BME280 humidity, pressure and temperature sensor module
- and three Buttons
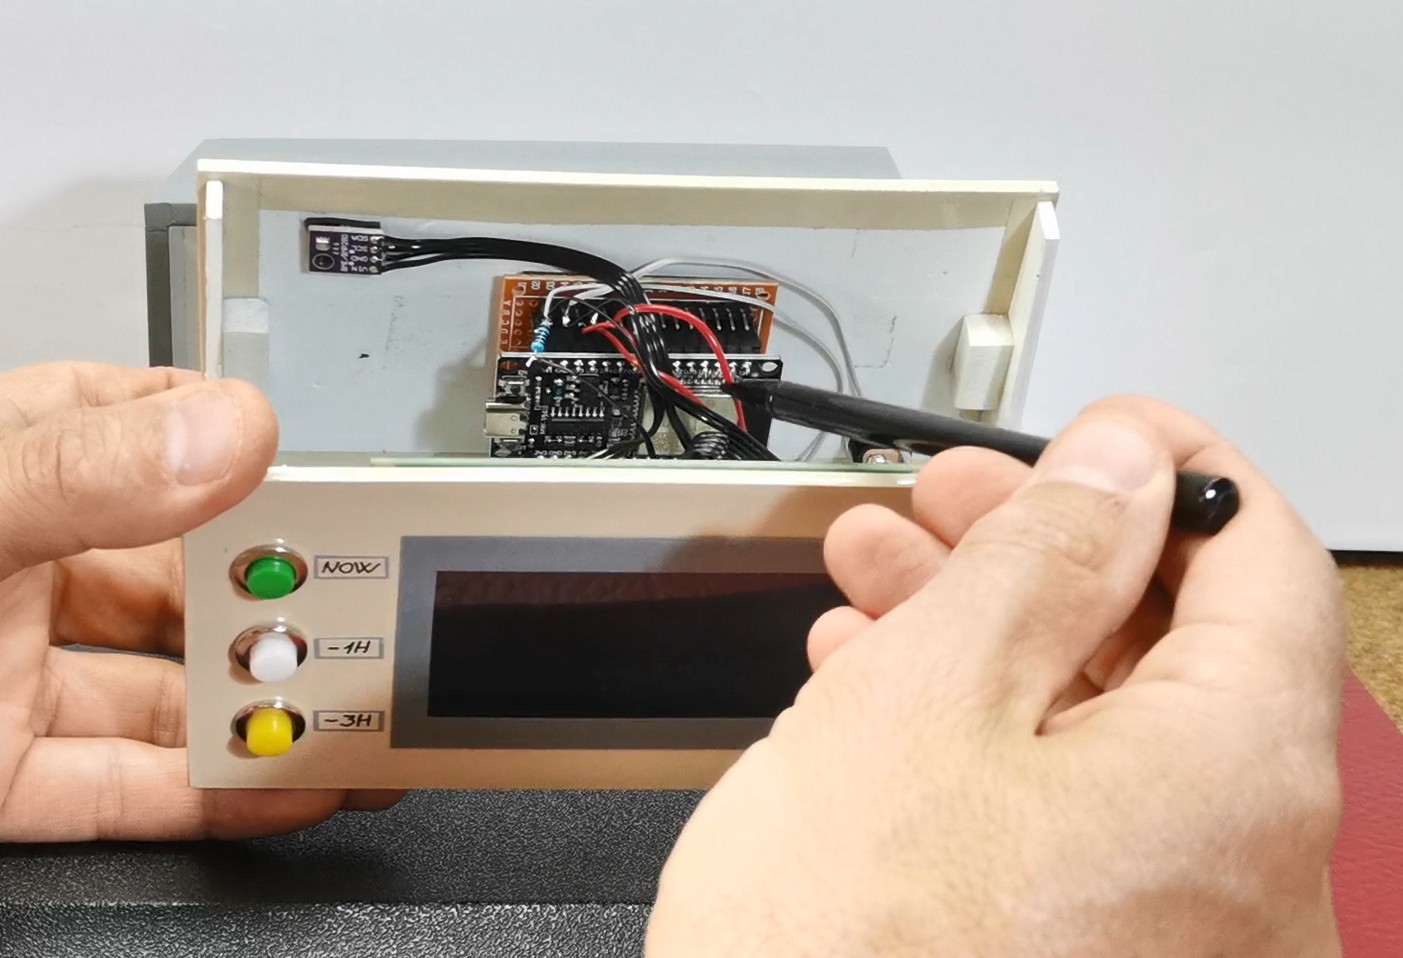
For a more accurate display of temperature and humidity, it is desirable to place the sensor module outside the housing or to make more ventilation holes. The contrast of the display is adjusted using a small trimmer potentiometer.
As for the code, as I mentioned earlier, I made several changes and improvements. First, instead of mmHg (millimeters of mercury), the value of atmospheric pressure is expressed in hPa which is the official unit of measurement for atmospheric pressure.
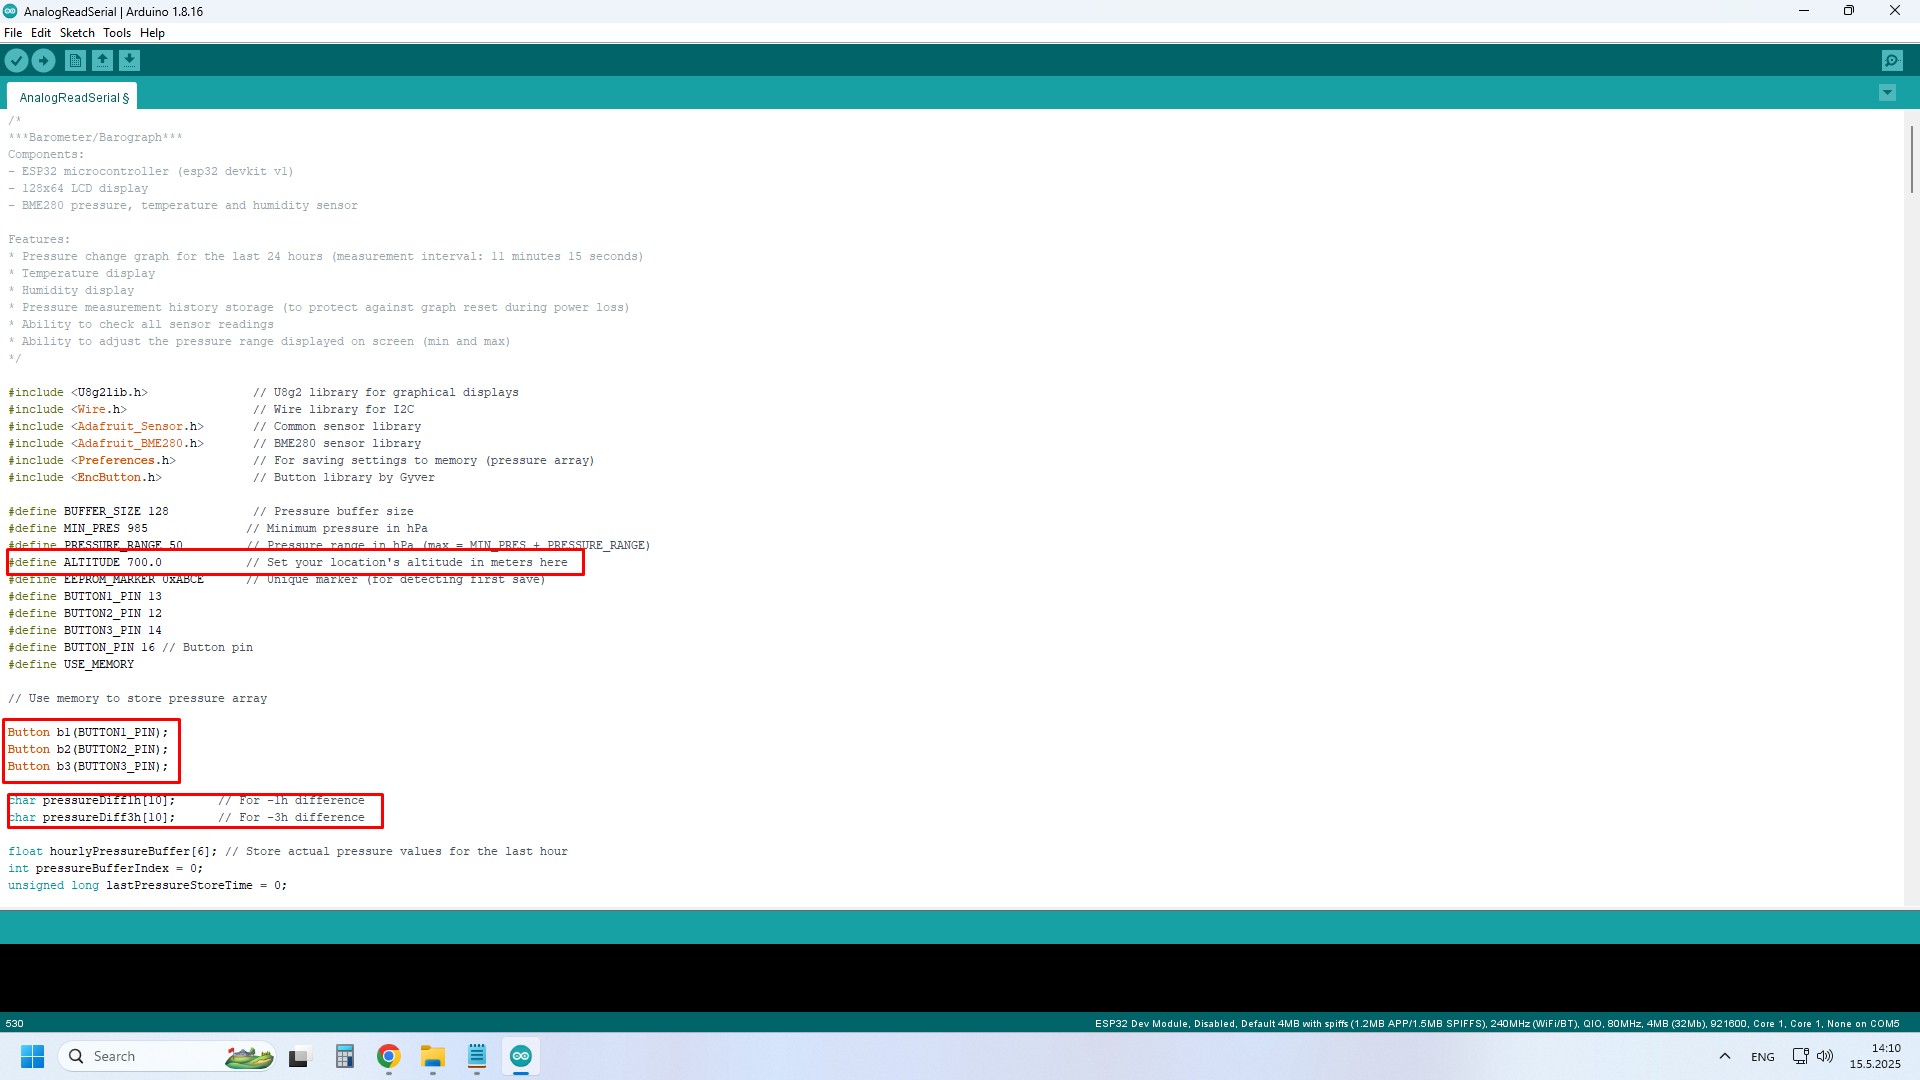
Next, instead of absolute atmospheric pressure, the relative atmospheric pressure is now calculated, based on the altitude at which the device is located, and which we need to enter in the code. Three more screens have also been added to display the necessary parameters. Also, in case of accidental power failure, the graph is remembered and the next time the barograph is turned on, we do not need to wait 24 hours for fill up.
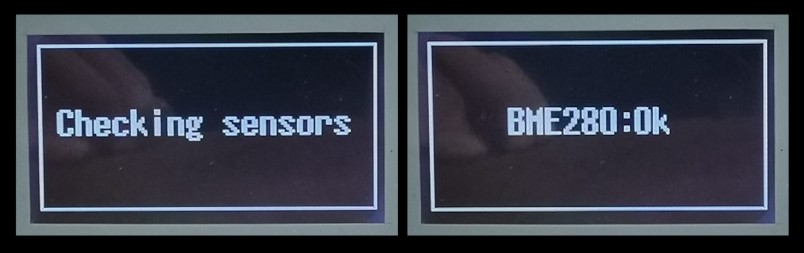
Let's take a look at how the barograph works. Immediately after turning on the device, a message appears on the screen to check the BME280 sensor.
After that, the main screen appears. Of course, the most important part here is the graph that shows the movement of atmospheric pressure over time. The entire graph is drawn with 128 vertical bars and the time covered by these bars is exactly 24 hours. This means that the value of atmospheric pressure on the graph is recorded every 11.25 minutes. On the right side are the latest measurements, and on the far left are the oldest measurements, in this case -24 hours. Similarly, in the middle are the values from 12 hours ago. In this way, we can visually see very quickly and accurately whether the atmospheric pressure has a trend of rise, steady or fall, which are actually basic indicators necessary for predicting local weather. I should also mention that the vertical resolution of the graph is exactly 1 hectopascal, which is quite sufficient for this purpose.
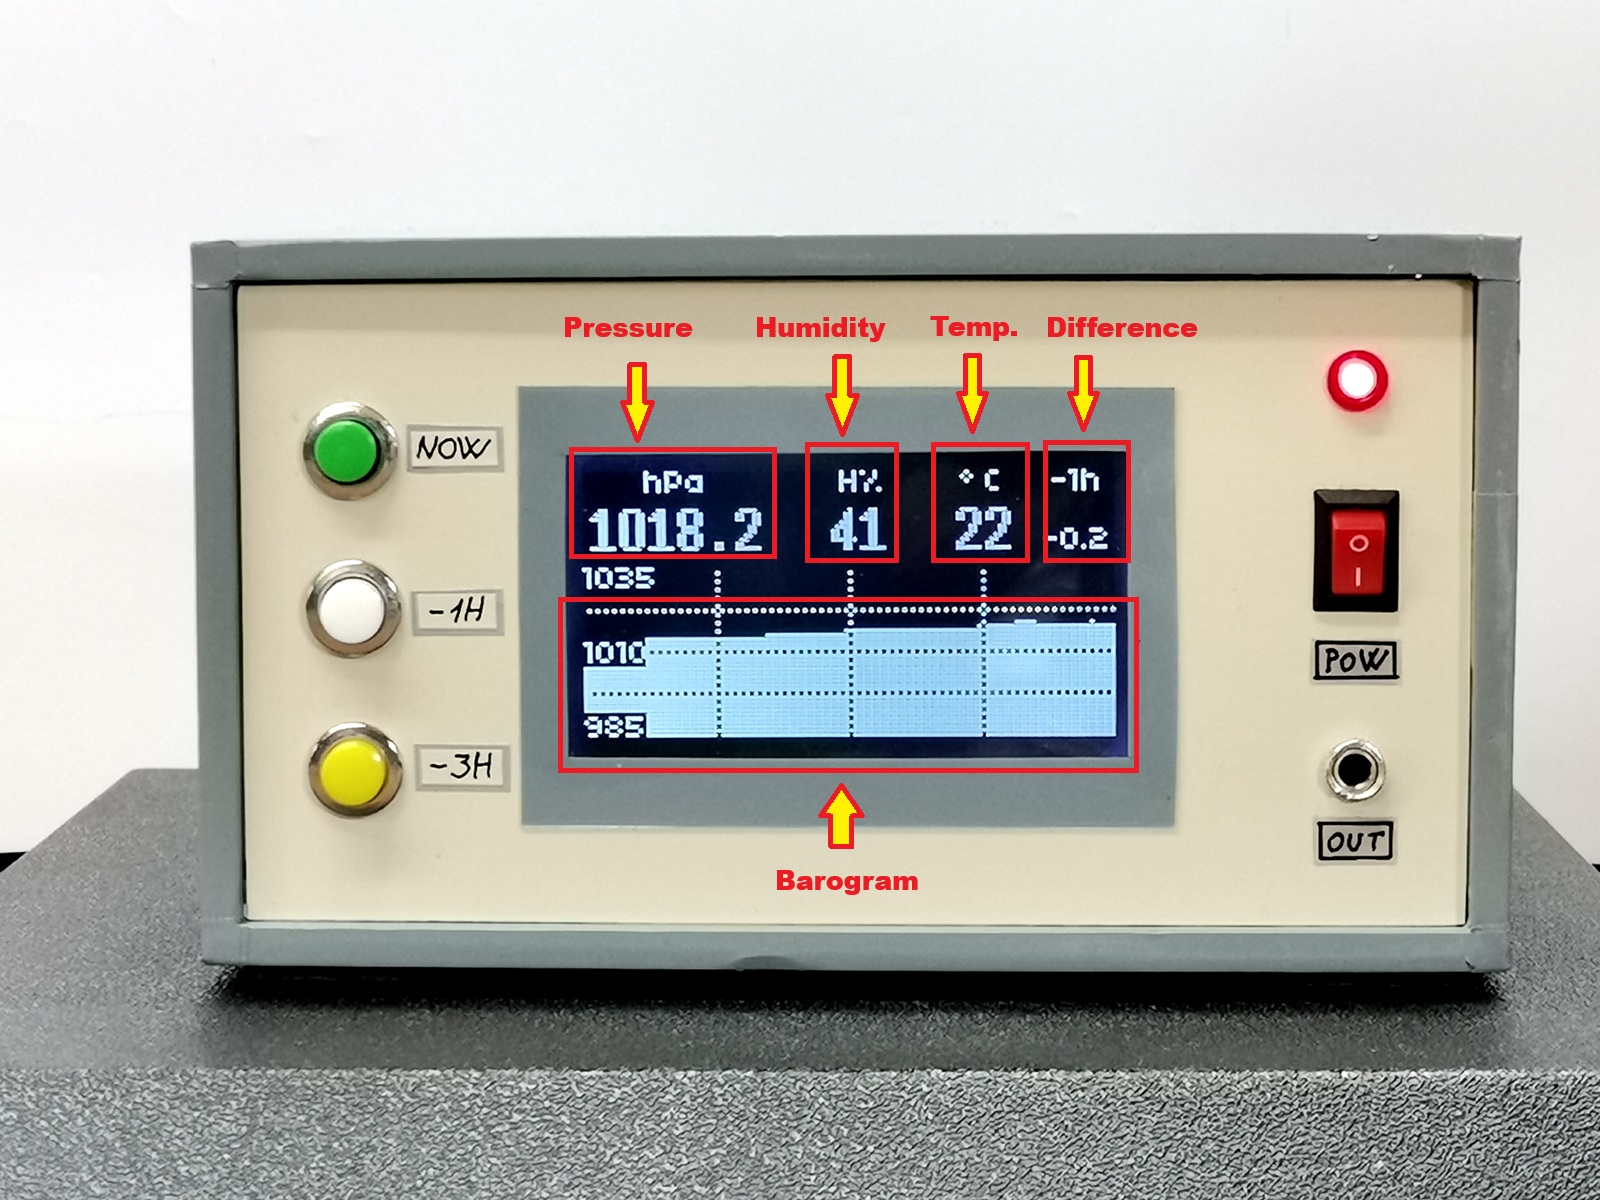
As you can see, there is still a lot of useful information on the screen. Here is the value of the current relative atmospheric pressure with a precision of one decimal place expressed in hectopascals. Then the relative humidity of the air expressed in percent, as well as the current temperature in degrees Celsius. On the far right, in small numbers, is shown the numerical value of the pressure trend in the last hour.
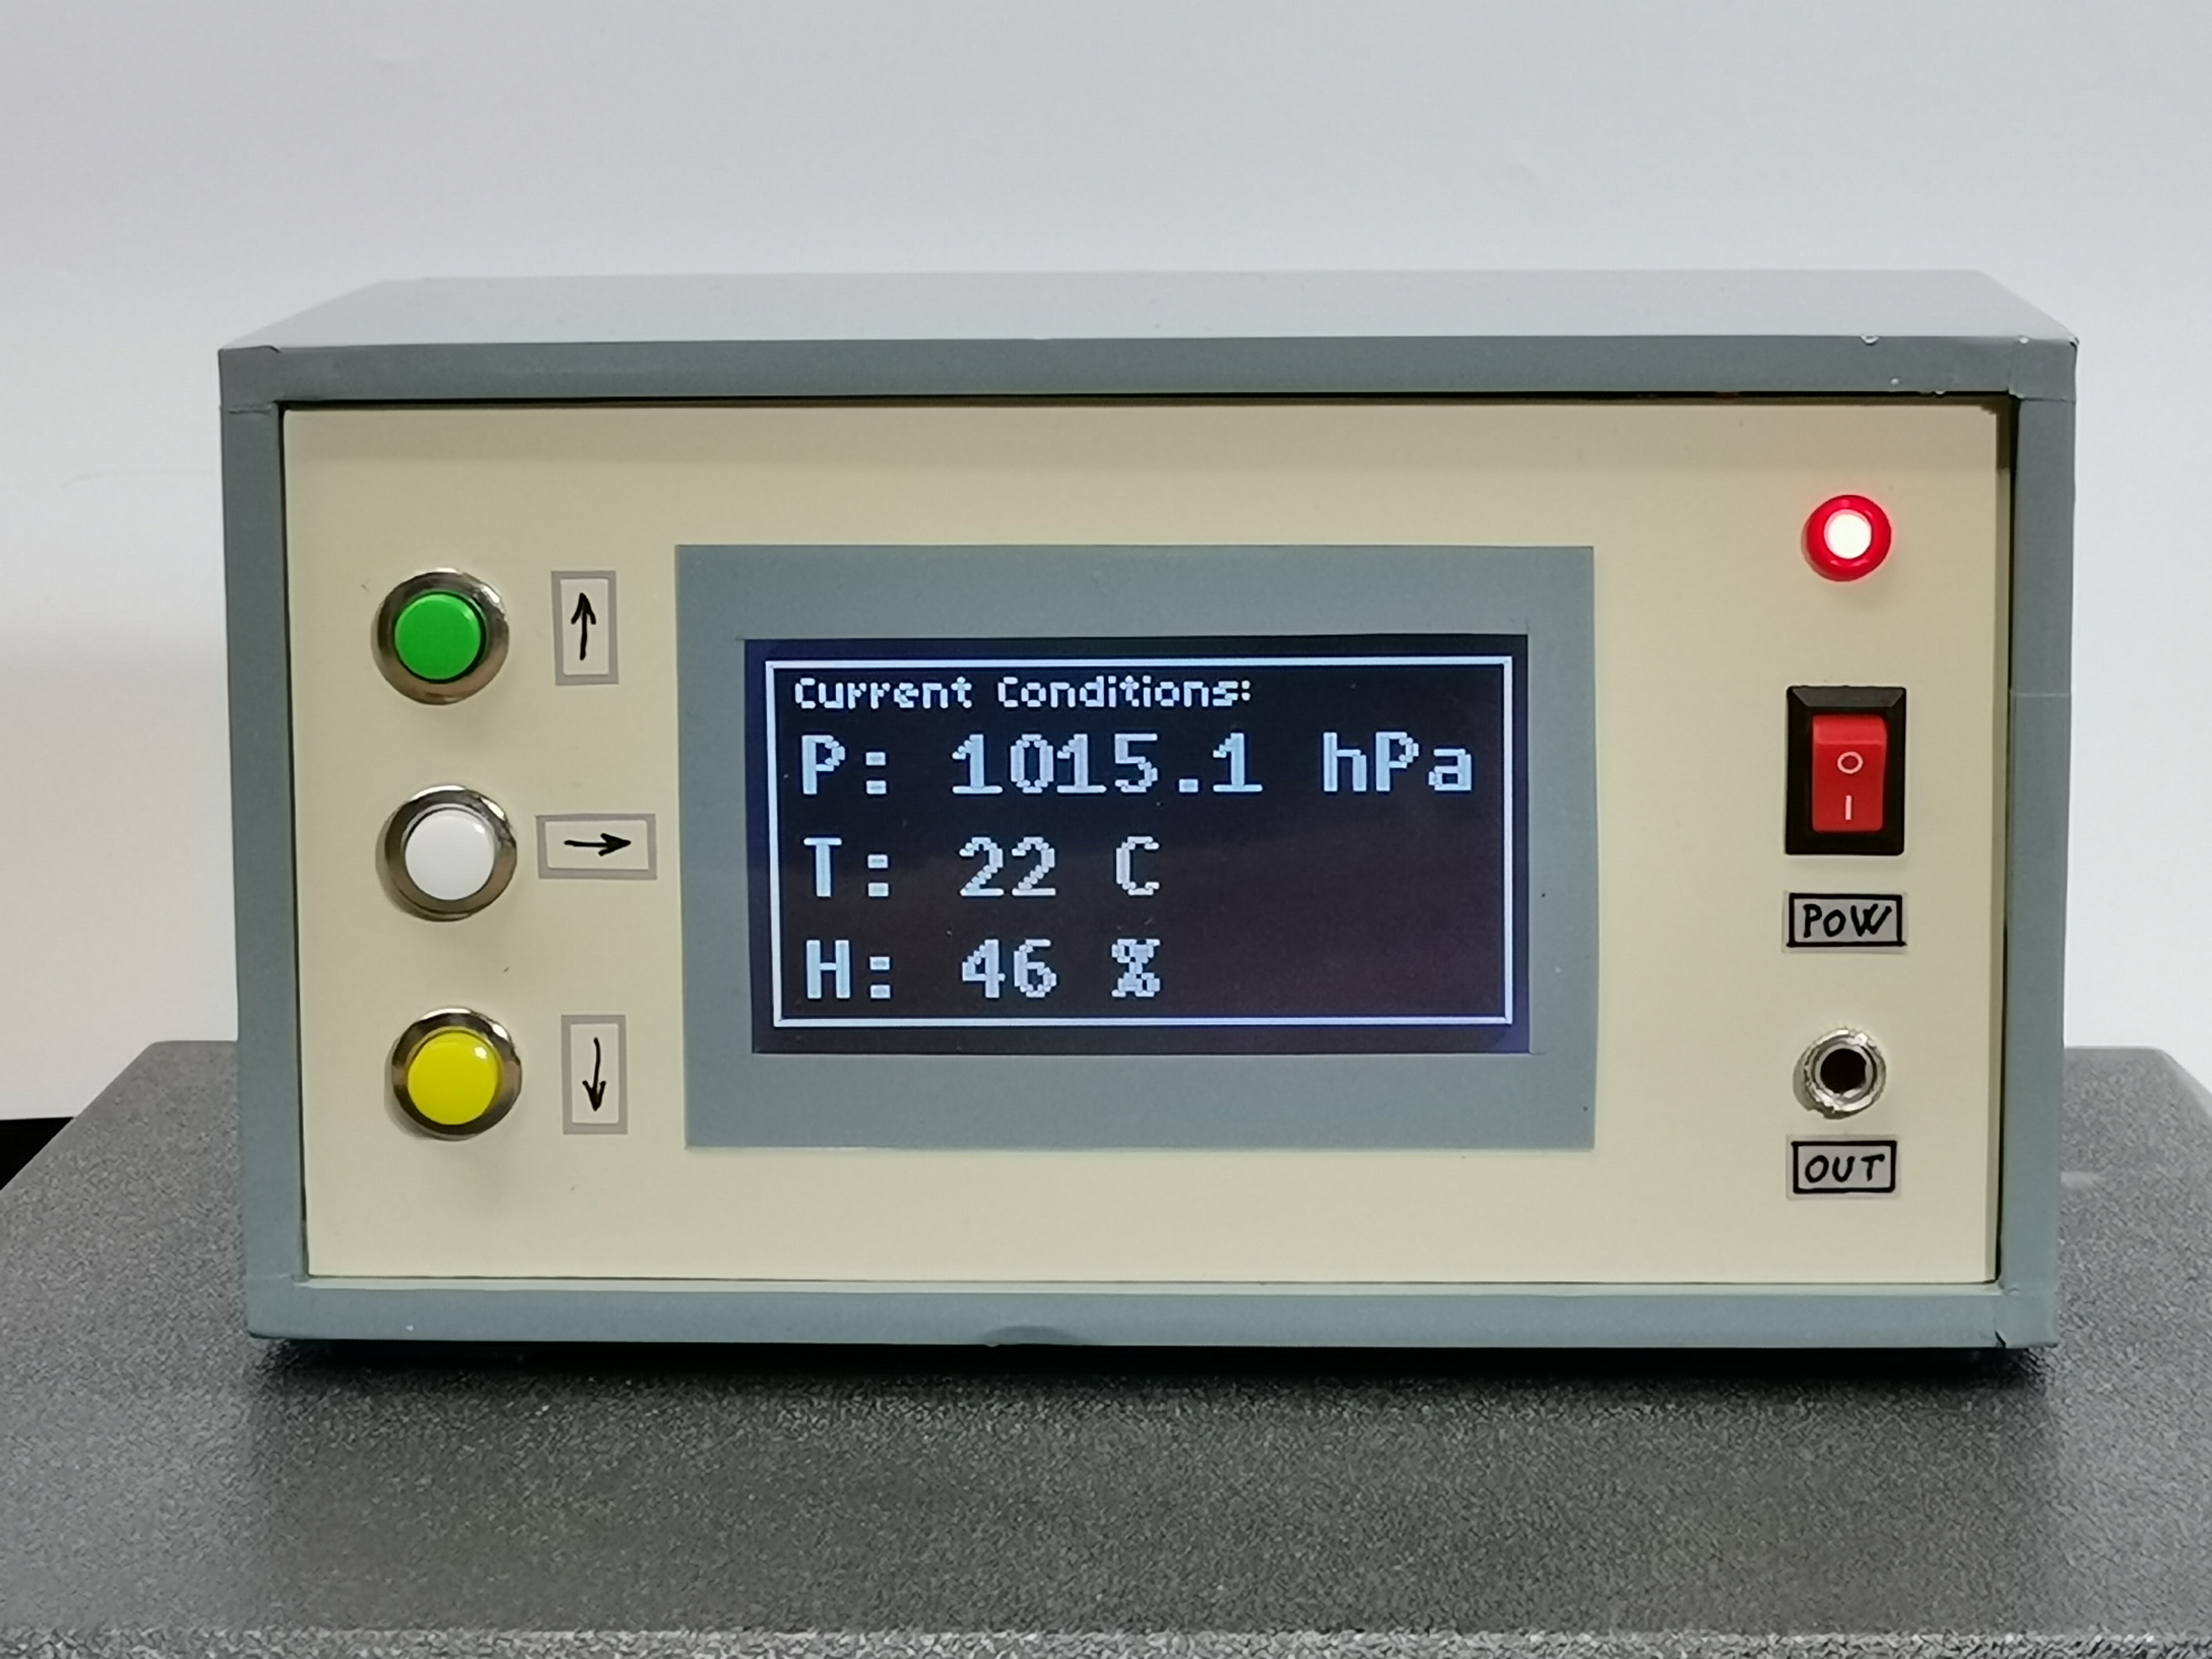
Since the housing in which the device is built is from one of my previous projects, there are also three buttons on it. So I decided to give each of them a specific function. By pressing the top button, a special screen opens on which the current values for the Pressure, temperature and humidity of the air are displayed in large characters.
This screen remains active until we press one of the other two buttons, at which time other appropriate information is displayed. If we press the same button once more, we return to the main screen. The other two buttons function in the same way. The middle one displays the value of the difference between the current pressure and the one from one hour ago, and the bottom button displays this difference from three hours ago.
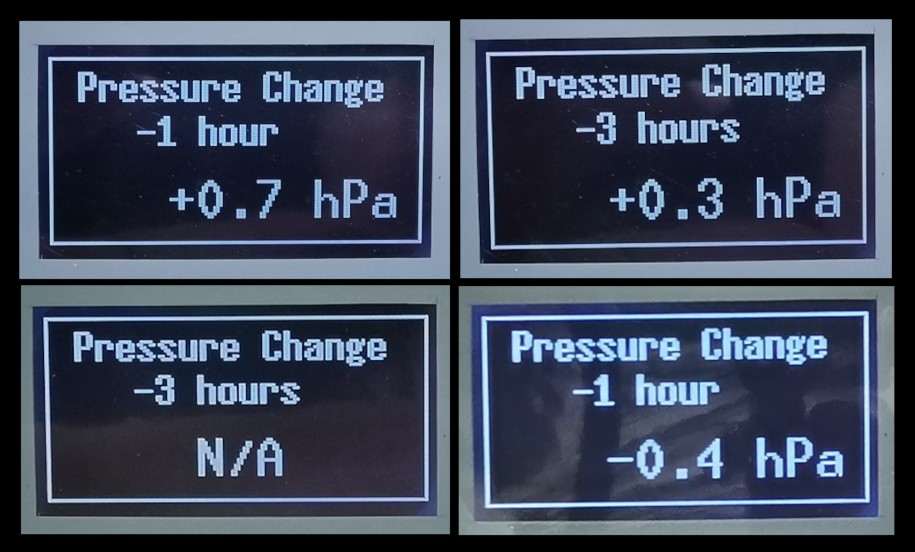
These two values are by definition the most important for short-term local weather forecasting. By default, the values are refreshed every 11 minutes, but if we press a button, the current values are taken, so there may be a minimal difference between different screens.
And finally, a short conclusion. This is a modern digital interpretation of a traditional barograph that displays real-time atmospheric pressure trends over a 24-hour period using a high-precision BME280 sensor and ESP32 microcontroller. The device features a 128x64 LCD display showing current barometric pressure, temperature, humidity, and a detailed pressure history graph, making it perfect for weather monitoring and forecasting.