


Story
Weather monitoring systems are widely used in smart homes, agriculture, industrial automation, and environmental monitoring applications. By continuously measuring environmental parameters such as temperature, humidity, atmospheric pressure, rainfall, and ambient light intensity, these systems provide valuable information about the surrounding conditions.
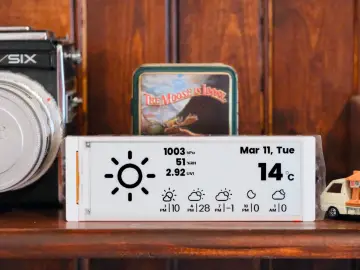
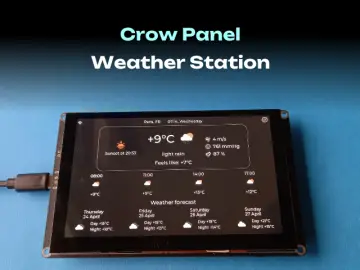
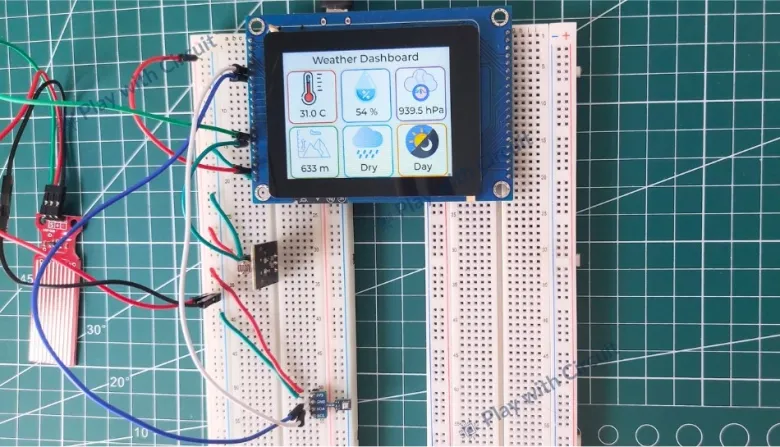
In this project, we will build a Smart Weather Monitoring System using the ESP32-S3 Smart Display, BME280 sensor, Rain Sensor, and LDR sensor. The collected sensor data is displayed in real time on a graphical dashboard created using the LVGL graphics library. This project was originally published on Play with Circuit. For full source code and complete project checkout the article: Weather Monitoring System Using ESP32-S3 Smart Display.
How Does the Weather Monitoring System Work?
The system continuously gathers environmental data using multiple sensors. The BME280 sensor measures temperature, humidity, and atmospheric pressure, while the Rain Sensor detects rainfall conditions and the LDR sensor determines whether it is day or night.
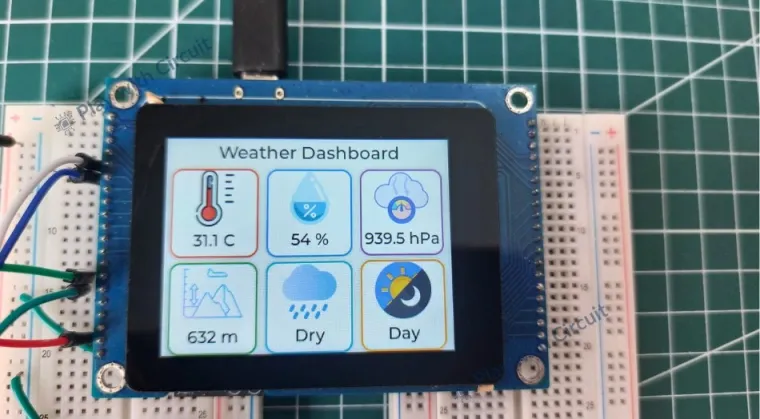
The ESP32-S3 processes these measurements and updates the LVGL-based dashboard in real time, providing an intuitive graphical interface for monitoring weather conditions.
Understanding LVGL Graphics Library
One of the highlights of this project is the use of the LVGL (Light and Versatile Graphics Library). LVGL is an open-source graphics framework specifically developed for embedded systems and microcontrollers. It provides various graphical components such as:
- Labels
- Buttons
- Images
- Icons
- Progress bars
- Sliders
- Animations
- Containers
These components allow developers to create professional-looking graphical user interfaces without requiring high-end processors.
Hardware Components Required
-
BME280 Sensor
-
Rain Sensor Module
-
LDR Sensor Module
-
Jumper Wires
-
USB Cable
Software Requirements
The software environment used for developing this project includes:
- Visual Studio Code (v1.116.0 or later)
- ESP-IDF Extension (v1.11.1 or later)
- ESP-IDF v5.3.5
- Python 3.11.2
- Bosch BME280 Library
- LVGL Port v8.4.0
For maximum compatibility, it is recommended to install all software packages using their default installation paths.
Circuit Diagram
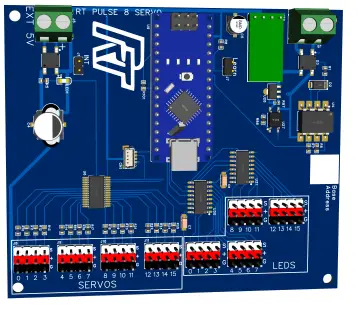
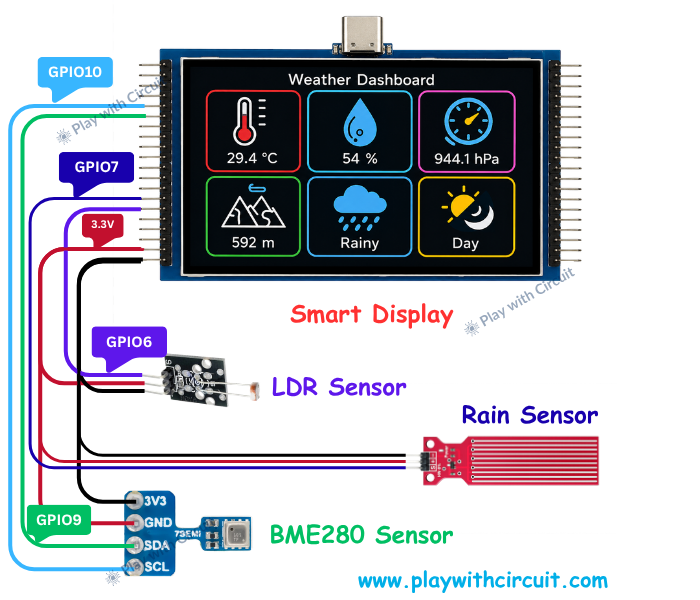
The following circuit diagram shows the connections between the ESP32-S3 Smart Display and the environmental sensors.
Understanding the Circuit Connections
BME280 Sensor Connections
The BME280 sensor communicates with the ESP32-S3 using the I2C protocol. GPIO9 is used as the SDA line, while GPIO10 serves as the SCL line. The sensor provides temperature, humidity, and atmospheric pressure measurements, which are further used to calculate altitude.
Rain Sensor Connections
The analog output of the Rain Sensor is connected to GPIO7, which is configured as an ADC input. Based on the measured voltage, the software determines whether the sensor surface is dry or wet.
LDR Sensor Connections
The LDR sensor is connected to GPIO6 through another ADC channel. By measuring the change in voltage caused by varying light intensity, the system determines whether it is day or night.
Software Implementation
The project is developed using the ESP-IDF framework and the LVGL graphics library.
The software consists of two major modules:
-
main.cpp – responsible for display initialization, dashboard creation, and updating sensor values.
-
sensors.c – responsible for sensor communication, ADC configuration, and environmental data acquisition.
Features
-
Real-Time Temperature Monitoring
-
Relative Humidity Measurement
-
Atmospheric Pressure Measurement
-
Altitude Estimation
-
Rainfall Detection
-
Day/Night Detection
-
LVGL-Based Graphical Dashboard
-
ESP32-S3 Processor
-
Compact Hardware Design
Applications
-
Home Weather Stations
-
Smart Agriculture
-
Greenhouse Monitoring
-
Environmental Monitoring
-
Industrial Automation
-
Educational Projects
-
IoT Applications
Project Demonstration
Conclusion
This project demonstrates how multiple environmental sensors can be interfaced directly with an ESP32-S3 Smart Display to create a compact and efficient weather monitoring system. Using the LVGL graphics library, the collected data is presented through an interactive dashboard, making the system suitable for IoT, automation, and environmental monitoring applications.